Exploring Crashes in iOS
A comprehensive guide to iOS crashes covering their nature as exception control flow, common causes, capture mechanisms, investigation methods, and governance.
A crash is the occasional “app freeze and exit” we encounter while using apps, directly impacting user experience and retention. The crash rate is one of the key metrics for measuring app quality.
This article focuses on the iOS ecosystem, combining system principles with practical experience, to systematically cover the following aspects of crashes:
- Nature: The mechanism of Exception Control Flow (ECF)
- Causes: Common causes sorted by frequency
- Propagation flow: Two distinct paths for low-level errors and high-level language errors
- Investigation methods: Tools for locating, reproducing, and debugging
- Case study: The conflict between KVO and dynamic class creation
- Governance system: Monitoring, prevention, and quality assurance
Helping developers build a stable crash quality assurance process.
A crash is essentially an Exception Control Flow (ECF) triggered by the operating system in response to an abnormal situation. When the CPU, kernel, or runtime detects an unrecoverable exception, the control flow jumps to an exception handler, ultimately potentially causing the process to exit.
ECF can occur at the hardware, kernel, and application layers:
- Hardware layer: Hardware detects an event (e.g., an I/O interrupt) and notifies the CPU
- Kernel layer: Kernel scheduling, context switching, or signal dispatching
- Application layer: The runtime or application logic actively throws exceptions or sends signals
Mobile app crashes primarily relate to the kernel and application layers, so the following discussion focuses on these two layers.
Operating systems classify exceptions into four categories: interrupts, traps, faults, and aborts. This classification comes from Chapter 8 of Computer Systems: A Programmer’s Perspective. Although some sources argue that interrupts are not exceptions, from the perspective of “the program not executing as originally intended,” they can be considered part of a broader definition of exceptions.
| Category | Cause | Async/Sync | Return Behavior |
|---|---|---|---|
| Interrupt | Signal from I/O device | Asynchronous | Always returns to the next instruction |
| Trap | Intentional exception | Synchronous | Always returns to the next instruction |
| Fault | Potentially recoverable error | Synchronous | May return to the current instruction |
| Abort | Unrecoverable error | Synchronous | Does not return |
The most common type leading to crashes in everyday development is fault, i.e., a potentially recoverable error. Once a fault cannot be repaired (e.g., a segmentation fault accessing invalid memory), the system sends a signal to the process or terminates it directly, manifesting as a crash. Common examples like EXC_BAD_ACCESS and SIGSEGV fall into this category.
Different runtimes have their own exception systems. The Java JVM manages exceptions through the Throwable -> Error / Exception abstraction hierarchy; most Android crashes are caught by the JVM and converted into Java stack traces.
The iOS runtime (Objective-C Runtime / Swift Runtime) also provides exception protection mechanisms, for example:
unrecognized selector sent to instance: triggered when sending an unknown message to an objectobjc_exception_throw:NSExceptionthrown by Objective-C- Swift-level
fatalErrorandpreconditionFailuretriggerSIGABRT
These protections can prevent an exception from falling directly to the kernel layer, but when an exception goes unhandled or escalates to a fatal error, it will still ultimately present as a crash.
The reasons for app crashes vary. Sorted by actual frequency from high to low, they mainly fall into the following four categories:
This is the most common type of crash in iOS development, typically manifesting as EXC_BAD_ACCESS or SIGSEGV. It mainly includes:
- Dangling pointers: Using a deallocated object, or failing to set a pointer to
nilafter the object is released - Out-of-bounds access: Accessing beyond the bounds of arrays, strings, and other containers
- Multithreading race conditions: Contention in writing to the same memory from multiple threads, causing memory corruption
- Writing to protected memory: Attempting to modify a read-only memory region (e.g., string literals)
At the application level, the memory layout diagram helps illustrate common issues:

From low address to high address: Code segment (.text) → Initialized data (.data) → Uninitialized data (.bss) → Heap → Stack
Common crash scenarios during process execution include:
- Using a deallocated object (dangling pointer)
- Contention in writing to the same memory from multiple threads
- Out-of-bounds access on arrays or structs
The iOS runtime (Objective-C Runtime / Swift Runtime) provides exception protection mechanisms that actively throw exceptions or trigger crashes when anomalous conditions are detected:
- Unrecognized message: Objective-C Runtime catches
unrecognized selector sent to instance - Container out-of-bounds / inserting
nil: Foundation and Swift containers actively throw exceptions or callfatalError - Type assertion failure: Swift’s
as!ortry!failure triggersSIGABRT - Force unwrapping
nil: Swift’s!force unwrap encounteringniltriggersSIGABRT
Low-level languages like C do not provide these protections; out-of-bounds access often results in reading or writing undefined memory directly.
The following code compares the behavior of C and Objective-C when accessing an array out of bounds:
int main () {    // C language: out-of-bounds access won't crash, but behavior is undefined    char str[6] = {'b','i','t','n','p','c'};    char c = str[6];                    // Won't crash, but reads undefined memory    printf("%c\n", c);                  // Prints an unknown character
// Objective-C: out-of-bounds access will crash NSArray *array = @[@"b", @"i", @"t", @"n", @"p", @"c"]; id obj = array[6]; // Crash: index 6 beyond bounds [0 .. 5] NSLog(@"%@\n", obj);}The iOS system may actively terminate an app based on resource management, security policies, and other factors:
- WatchDog: The system monitors the main thread and app launch duration. If the UI main thread freezes beyond the threshold or cold launch times out, WatchDog kills the app
- Memory pressure: Receiving
didReceiveMemoryWarningwithout releasing resources in time, or a background app exceeding memory limits, prompts the system to reclaim the process - Heat and power consumption: Prolonged high CPU/GPU load can trigger system frequency scaling or even force-quit the foreground app (relatively rare)
- Code signing / certificate issues: Expired enterprise certificates, invalid signatures, and signature verification failures in jailbroken environments can cause the system to terminate the app during launch
These crashes are typically caused by low-level hardware or instruction-level errors and are relatively rare in everyday development:
- Illegal arithmetic operations: Dividing by zero, floating-point overflow, etc., can trigger
SIGFPE - Invalid instructions: Executing undefined or architecture-unsupported instructions at runtime triggers
SIGILL, commonly seen when mixing binaries of different architectures or with incorrect function pointers
There are two main paths for crash propagation in iOS, depending on the source of the error:
Path One: Low-level errors (e.g., dangling pointers, illegal memory access)
- Hardware/kernel detects an exception → Mach exception → Unix Signal
- These errors are caught directly by the lower layers of the system, bypassing the language runtime
Path Two: High-level language errors (e.g., array out-of-bounds, unrecognized selector)
- Objective-C/Swift Runtime detects → NSException → Uncaught, calls
abort()→ SIGABRT - These errors are actively thrown by the language runtime; if no exception handler is set, they ultimately trigger a signal via
abort()
To better understand the differences between the two paths, here are common crash scenarios:
Scenario 1: Pure signal crash (no NSException)
These crashes are triggered directly by the underlying system, bypassing the language runtime, so there is no corresponding NSException — they can only be caught via signals:
- Dangling pointer access →
SIGSEGV - Stack overflow →
SIGTRAP - Memory limit →
SIGKILL
Scenario 2: Signal triggered by NSException
These crashes are detected by the language runtime, which throws an NSException; if uncaught, a signal is triggered. The specific error information needs to be obtained through the NSException layer:
- Array out-of-bounds →
NSRangeException→SIGABRT - Message forwarding failure →
NSInvalidArgumentException→SIGABRT - Swift optional force unwrap of nil →
NSException→SIGABRT
Mach exceptions are the lowest-level kernel exceptions, such as EXC_BAD_ACCESS. When an exception occurs, it is converted into a Mach message by the exception handler, then delivered sequentially to the thread, task, and host ports.
By listening on these ports, Mach-level exceptions can be captured. Below is an example using PLCrashReporter (only key code is listed; see PLCrashMachExceptionServer for the full implementation):
// Initialize Mach exception server context// 1. Create server portmach_port_allocate(mach_task_self(), MACH_PORT_RIGHT_RECEIVE, &_serverContext->server_port);
// 2. Create notification portmach_port_allocate(mach_task_self(), MACH_PORT_RIGHT_RECEIVE, &_serverContext->notify_port);mach_port_insert_right(mach_task_self(), _serverContext->notify_port,                       _serverContext->notify_port, MACH_MSG_TYPE_MAKE_SEND);
// 3. Create port setmach_port_allocate(mach_task_self(), MACH_PORT_RIGHT_PORT_SET, &_serverContext->port_set);
// 4. Add server port and notification port to the port setmach_port_move_member(mach_task_self(), _serverContext->server_port, _serverContext->port_set);mach_port_move_member(mach_task_self(), _serverContext->notify_port, _serverContext->port_set);
// 5. Create exception handling threadpthread_create(&thr, &attr, &exception_server_thread, _serverContext);
Open-source solutions like PLCrashReporter and KSCrash register Mach exception ports at the low level, intercept exceptions in advance, persist the stack trace, and then hand the exception back to the system’s normal delivery flow, ensuring default behavior is not disrupted.
| Exception Type | Description | Notes |
|---|---|---|
EXC_BAD_ACCESS | Bad Memory Access | Invalid memory address — either the address does not exist or the current process lacks permission to access it. Commonly seen in Path One (low-level errors) |
EXC_CRASH | Abnormal Exit | Usually accompanied by the SIGABRT UNIX Signal, indicating an abnormal process exit. Commonly seen in Path Two (high-level language errors) when an uncaught NSException triggers abort() |
EXC_BAD_INSTRUCTION | Illegal Instruction | Illegal or undefined instruction or operand. Commonly seen in Path One (low-level errors) |
Unix Signal is an asynchronous notification mechanism in Unix systems. For low-level errors (Path One), Mach exceptions are converted into corresponding Unix Signals by ux_exception at the host layer, and threadsignal delivers the signal to the faulting thread, such as SIGSEGV or SIGBUS. For high-level language errors (Path Two), an uncaught NSException calls abort(), directly triggering SIGABRT.
At the Unix layer, the signal / sigaction functions can be used to register signal handler callbacks, recording critical information to a file or uploading it to a server. The following code uses a single signalHandler to handle received SIGBUS:
void signalHandler(int sig) {    printf("signal %d received.\n", sig);    // Here you can save stack info, write logs, etc.    exit(1);}
int main() { signal(SIGBUS, signalHandler); char *str = "bitnpc"; // String literal in read-only segment str[0] = 'H'; // Attempt to modify read-only memory, triggers SIGBUS return 0;}The following table lists common Unix Signals. On macOS, you can type man signal to see the full list of signals. It can also be found here.
| Unix Signal | Description |
|---|---|
SIGSEGV | Access to an invalid memory address — the address exists but the current process does not have permission to access it. This is a hardware-level error |
SIGABRT | Abnormal program termination, typically triggered by the C abort() function, or by runtime assertion failures, Swift’s fatalError, etc. This is a software-level error |
SIGBUS | Access to an invalid memory address — the difference from SIGSEGV is that SIGBUS indicates the memory address does not exist. This is a hardware-level error |
SIGTRAP | Debugger-related |
SIGILL | Attempt to execute an illegal, unknown, or unauthorized instruction |
NSException is an exception object thrown by the Objective-C runtime, typically triggered by the language runtime’s protection mechanisms (e.g., array out-of-bounds, unrecognized selector, etc.). By registering a handler function via NSSetUncaughtExceptionHandler, you can capture the exception name, reason, and call stack before a crash and persist them. A common practice is to write this information to a sandbox file in the handler and upload it on the next app launch, avoiding complex logic at the crash site.
The following code demonstrates basic usage:
void exceptionHandler(NSException *exception) {    // Retrieve exception information    NSString *name = [exception name];                          // Exception name    NSString *reason = [exception reason];                      // Reason for the exception    NSArray *stackArray = [exception callStackSymbols];         // Exception stack trace
    // Persist exception information (write to file or upload to server)    NSLog(@"Exception: %@, Reason: %@", name, reason);    NSLog(@"Stack: %@", stackArray);
    // Note: Do not perform time-consuming operations here to avoid compromising crash log integrity}
int main(int argc, char * argv[]) {    // Register uncaught exception handler    NSSetUncaughtExceptionHandler(&exceptionHandler);
// Example of triggering an exception NSArray *array = @[@"b", @"i", @"t", @"n", @"p", @"c"]; id obj = array[6]; // Triggers NSRangeException return 0;}The data obtained after capturing a crash consists of virtual memory addresses. We need to translate these virtual memory addresses into readable stack traces. The essence of symbolication is to find the method name corresponding to a memory address in a mapping file.
Common symbolication methods include:
- Xcode Organizer / Devices panel: Automatic symbolication, suitable for local debugging
- symbolicatecrash script: Offline symbolication, suitable for batch processing
- atos / atosl: Locate symbols by address, useful for custom-built platforms
Under normal circumstances, crashes that occur during debugging are easy to fix. However, after an app is released, crashes that were never seen locally and are difficult to reproduce often appear. The crash log alone often does not directly pinpoint the problem, requiring a systematic investigation approach.
- Gather clues: Confirm system version, app version, user operation path, stack trace, thread information, device model, battery level, network environment, etc.
- Reconstruct the scene: Use event tracking or operation replay logs (e.g., Logan, Matrix) to identify the trigger path
- Quick comparison: Compare differences with the previous version, paying attention to recently merged modules and experiment toggles
- Local reproduction: Use breakpoints to trace back and feature toggles to precisely hit the crash path
- Increase hit rate: Enable
Malloc Scribble,NSZombie,Thread Sanitizer,Address Sanitizerin Xcode’sDiagnostics - Multithreading scenarios: Write scripts to trigger the issue concurrently across multiple threads to increase the probability of reproduction
The principle is to fill deallocated objects with 0x55, ensuring that dangling pointer calls will inevitably crash.
Take the following code as an example (ARC is disabled for clarity):
UIView *view = [UIView new];[view release];[view setNeedsLayout]; // Sending a message to a deallocated objectClearly, the object view points to has been deallocated, but the view pointer was not set to nil. So we are sending a message to a deallocated object. However, upon compilation and execution, we find that it does not crash.
After enabling Malloc Scribble, you can clearly see from the debug panel that a crash occurs at the third line.
Deallocated objects are marked as zombie objects. Xcode accomplishes this using the runtime method object_setClass, overwriting the isa of the released view to _NSZombie_UIView.
In addition to the aforementioned Memory Management tools, Xcode also provides Runtime Sanitization tools (actually features provided by the LLVM compiler). For example, Thread Sanitizer can detect race condition access, helping developers identify potential issues.
This is a real production crash case, demonstrating the conflict between dynamic class creation and KVO mechanisms in a multithreaded environment.
Below is a real crash log, with irrelevant parts omitted for readability.
Incident Identifier: 61590478-FA94-496E-9208-D2016678D6D0CrashReporter Key:   TODOHardware Model:      iPhone7,2Process:         imeituan [10672]Path:            /var/containers/Bundle/Application/2140260F-0484-4CED-AC09-DEC9B620A63A/imeituan.app/imeituanIdentifier:      com.meituan.imeituanVersion:         9.1.0 (3123)Code Type:       ARM-64Parent Process:  ??? [1]
Date/Time:       2018-11-12 08:44:34 +0000OS Version:      iPhone OS 10.1.1 (14B100)Report Version:  104
Exception Type:  SIGSEGVException Codes: SEGV_ACCERR at 0x20Crashed Thread:  22
Thread 22 Crashed:0 libobjc.A.dylib objc_registerClassPair + 321 Foundation _NSKVONotifyingCreateInfoWithOriginalClass + 1362 Foundation _NSKeyValueContainerClassGetNotifyingInfo + 803 Foundation -[NSKeyValueUnnestedProperty _isaForAutonotifying] + 844 Foundation -[NSKeyValueUnnestedProperty isaForAutonotifying] + 1005 Foundation -[NSObject(NSKeyValueObserverRegistration) _addObserver:forProperty:options:context:] + 4366 Foundation -[NSObject(NSKeyValueObserverRegistration) addObserver:forKeyPath:options:context:] + 1247 imeituan -[NSObject(RACSelectorSignal) racSignal_addObserver:forKeyPath:options:context:] (NSObject+RACSelectorSignal.m:63)8 imeituan -[RACKVOTrampoline initWithTarget:observer:keyPath:options:block:] (RACKVOTrampoline.m:50)9 imeituan -[NSObject(RACKVOWrapper) rac_observeKeyPath:options:observer:block:] (NSObject+RACKVOWrapper.m:115)10 imeituan __84-[NSObject(RACPropertySubscribing) rac_valuesAndChangesForKeyPath:options:observer:]_block_invoke.41 (NSObject+RACPropertySubscribing.m:0)......49 imeituan -[TPKxxxItem initWithText:jumpUrlString:] (TPKPOIDetailLookMoreCell.m:60)50 imeituan -[TPKxxxViewModel itemsWithModel:] (TPKxxxViewModel.m:102)51 imeituan __51-[TPKxxxViewModel setupViewModel]_block_invoke (TPKxxxViewModel.m:43)......First, let’s search through the stack trace. The searchable part of the stack is lines 0-6. For example, searching for objc_registerClassPair — it is a method called by the runtime when creating a class. But this information alone is insufficient to pinpoint the issue.
From the fourth line of the stack, we found articles about crashes caused by KVO creating classes with duplicate names. However, this project is componentized, and each pod has a different prefix, so there should be no issue with multiple symbols coexisting in different binaries.
Next, let’s see if we can reproduce the issue. Navigate to the page corresponding to TPKxxxViewModel and find that no crash occurs. Considering that the crash thread is a background thread, it is very likely a problem caused by creating TPKxxxItem from multiple threads. We can write some test code to try to reproduce it. Note that the timing of this code execution should match when the item would actually be created.
// Concurrently creating objects from multiple threads to attempt reproductionfor (int i = 0; i < 5; i++) { dispatch_async(dispatch_get_global_queue(DISPATCH_PRIORITY_DEFAULT, 0), ^{ TPKxxxItem *item = [[TPKxxxItem alloc] initWithText:@"bit" jumpUrlString:@"npc"]; });}Fortunately, we successfully reproduced it. The crash occurred in a foundational library within the project. Checking the change log of that library revealed some new swizzle operations. One step in that class involves a KVO-like mechanism that creates a new class during the process. However, subsequent operations also observe the same class via KVO. So, our problem boils down to KVO crashing when creating a subclass with the same name, which aligns with the information gathered earlier.
So why does KVO crash when creating a subclass with the same name? We know that KVO mainly does the following:
- Uses
objc_allocateClassPairandobjc_registerClassPairto dynamically create a new class:NSKVONotifying_xxx, which is a subclass of the original class - Points the original object’s
isapointer to the newly createdNSKVONotifying_xxxclass - Adds the new class to the global class table
- Overrides the new class’s setter method to call
willChangeValueForKey:anddidChangeValueForKey:
In step one, what happens if two new classes with the same name are created? We can write test code to verify:
- (void)applicationDidFinishLaunching:(NSNotification *)aNotification {    // First creation of class with the same name, succeeds    Class testClass1 = objc_allocateClassPair([NSObject class], "bitnpc_crash_test", 0);    objc_registerClassPair(testClass1);
    // Second creation of class with the same name, objc_allocateClassPair returns nil    Class testClass2 = objc_allocateClassPair([NSObject class], "bitnpc_crash_test", 0);    objc_registerClassPair(testClass2);  // EXC_BAD_ACCESS: Passing nil causes crash}
When calling objc_allocateClassPair, the returned class is nil. Then, when registering the new class with objc_registerClassPair, the nil parameter causes the crash.
Looking at the objc-runtime source code (objc4-723), we can see that if getClass(name) returns a non-nil class, it directly returns nil without allocating new memory:
/************************************************************************ objc_allocateClassPair* fixme* Locking: acquires runtimeLock**********************************************************************/Class objc_allocateClassPair(Class superclass, const char *name,                             size_t extraBytes){    Class cls, meta;
    rwlock_writer_t lock(runtimeLock);
    // Fail if the class name is in use.    // Fail if the superclass isn't kosher.    if (getClass(name)  ||  !verifySuperclass(superclass, true/*rootOK*/)) {        return nil;  // Class name already exists, return nil    }
    // Allocate new classes.    cls  = alloc_class_for_subclass(superclass, extraBytes);    meta = alloc_class_for_subclass(superclass, extraBytes);
    // fixme mangle the name if it looks swift-y?    objc_initializeClassPair_internal(superclass, name, cls, meta);
return cls;}At this point, the cause is very clear. The following flowchart illustrates the problem:
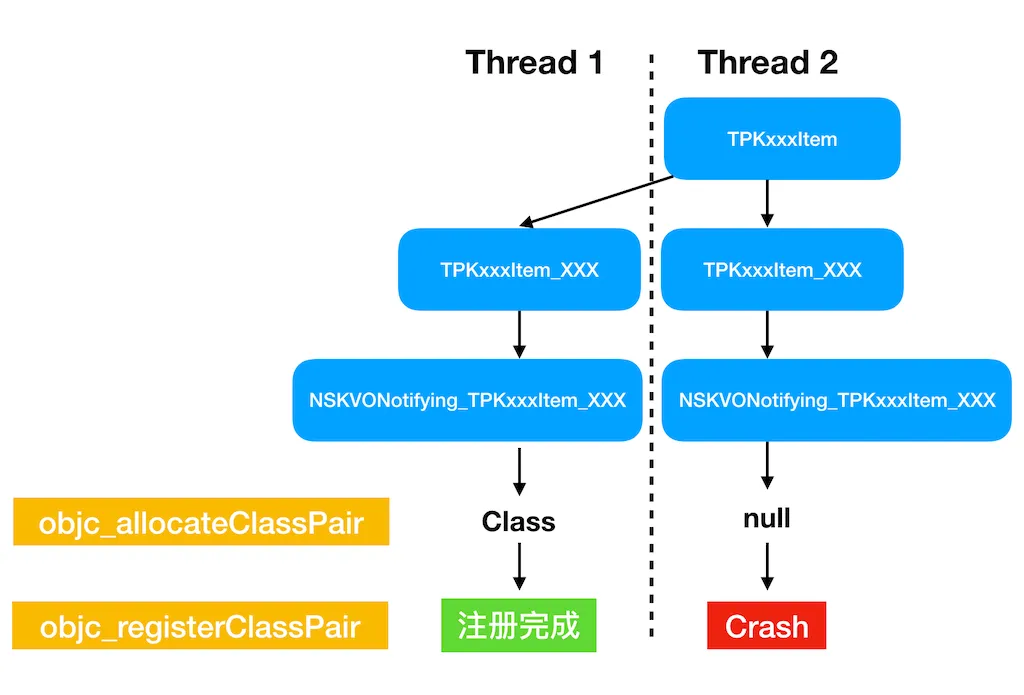
A foundational library in the project created two TPKxxxItem_XXX classes — let’s call them intermediate classes. When KVO tried to create subclasses from these two intermediate classes, it failed to allocate memory space, causing objc_registerClassPair to crash.
// Use dispatch_once or locking to ensure thread safetystatic NSMutableDictionary *classCache = nil;static dispatch_once_t onceToken;dispatch_once(&onceToken, ^{    classCache = [NSMutableDictionary dictionary];});
@synchronized(self.class) { NSString *className = NSStringFromClass(self.class); Class cachedClass = classCache[className]; if (!cachedClass) { // Create intermediate class cachedClass = objc_allocateClassPair([self class], "TPKxxxItem_XXX", 0); if (cachedClass) { objc_registerClassPair(cachedClass); classCache[className] = cachedClass; } } return cachedClass;}- Core metrics: Focus on cold-start crash rate, active-user crash rate (percentage of DAU users who crash), and scenario crash rate (broken down by page/feature), combined with metrics on lag and OOM
- Collection strategy: The client reports crash logs, thread stacks, device information, and recent actions on the next launch; the server aggregates data to compute metrics
- Governance loop: Combine build information and canary batches to bucket crashes (first occurrence, regression, core path), set SLAs and alert thresholds
- Toolchain: Common solutions include Crashlytics, Bugly, Sentry, or a custom reporting system built on PLCrashReporter; cross-validate with Xcode Organizer and App Store Connect’s
Metrics/Analytics - Prevention mechanisms: Enable debugging tools like ASan, TSan, Malloc Guard, and Zombie in internal test builds; use static analysis (Clang Static Analyzer, Infer) and unit tests to cover key modules; leverage Feature Flags for quick degradation in production
This article, grounded in the operating system’s exception control mechanism, has examined the nature of crashes, common causes, propagation flow, capture layers, and symbolication methods, along with investigation approaches and a real-world case study.
- Nature of crashes: Exception Control Flow (ECF), a multi-layered exception handling mechanism from the hardware layer to the application layer
- Common causes (by frequency): Invalid memory access (most common) → Language runtime protection mechanisms → OS policy restrictions → CPU unable to execute code (relatively rare)
- Propagation flow: Two main paths
- Path One (low-level errors): Mach exception → Unix Signal
- Path Two (high-level language errors): NSException →
abort()→ SIGABRT - Handlers should be registered at multiple layers to capture complete information
- Investigation approach: Gather clues → Reconstruct scene → Attempt reproduction → Locate problem → Fix and verify
- Best practices: Thread safety, naming conventions, monitoring system, toolchain construction